Coverage and Mentions in different platforms
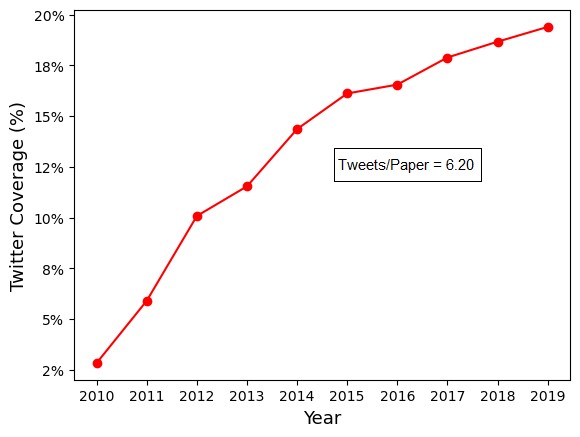
The social media coverage and mentions per paper have also been analysed for certain selected platforms. In case of Twitter, the coverage percentage has increased from 2.84% in 2010 to 19.4% in 2019, with 6.20 average tweets per paper. The figure below shows the year-wise coverage percentage of the research in Twitter.
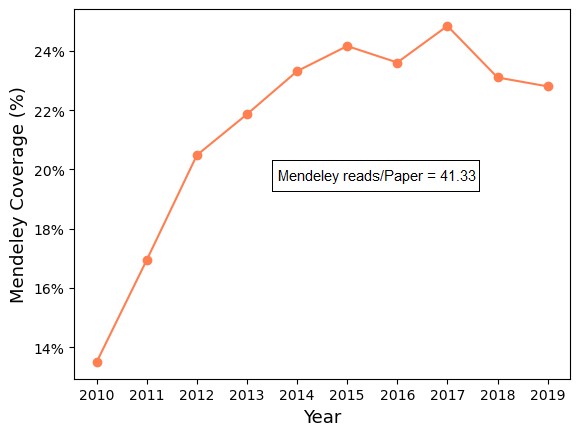
In case of Mendeley, the coverage percentage has increased from 13.5% in 2010 to 24.84% in 2017 and finally reaching 22.8% in 2019, with 41.33 average mentions per paper. The figure below shows the year-wise coverage percentage of the research in Mendeley.
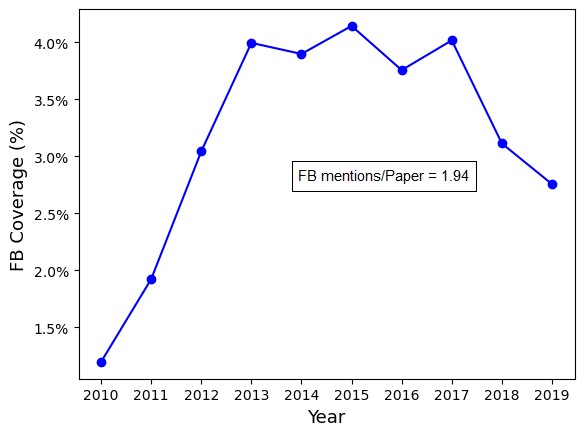
In case of Facebook, the coverage percentage has increased from 1.19% in 2010 to 4.14% in 2015, before settling down at 2.75% in 2019, with 1.94 average mentions per paper. The figure below shows the year-wise coverage percentage of the research in Facebook.
Social Media and Altmetric Coverage by Subject Area
| Rank | Subject | Altmetric Coverage | Twitter Coverage | Average Tweets per Paper | Facebook Coverage | Average Facebook Mentions per Paper | Mendeley Coverage | Average Mendeley Mentions per Paper |
|---|
Social Media Visibility of Indian Research Output
The altmetrics (used for Alternative Metrics) have recently emerged as a popular measure of impact of research, in addition to the traditionally used measure of citations. Altmetrics aims to capture the social media activity around scientific research. Some studies have suggested that on an average, about 48% of Research output of the world gets some Social Media attention. In this context, the social media attention level for Indian Research Output during 2010-2019, has also been computed. It is observed that out of the total research output in 2010, 13.7% of the research output gets some social media attention. This level has continuously increased during the period, reaching to 25.2% in 2017 and settling down to 23.3% in 2019. The figure below shows the year-wise altmetric coverage percentage for the Indian Research output during 2010 - 2019 period.