Subject area-wise Gender Distribution
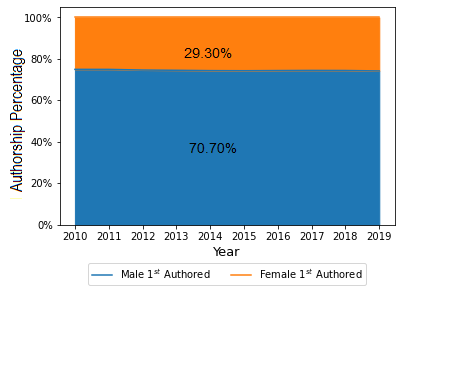
The gender distribution of Indian papers are also analysed with respect to different subject areas. While majority of
the 22 subject areas have almost similar percentage of Female 1st authored papers, subject areas like
History & Archaeology, Built Environment & Design and Law & Legal studies have a slightly higher percentage of Female 1st
authored papers. In general, only about one-fourth of the research papers in majority of the subject areas have Female
1st author. The table below presents percentage of Female and Male 1st authored papers in different
subject areas.
| Subject |
Male 1st authored papers (%) |
Female 1st authored papers (%) |
| 06 Biological Sciences |
74.01 |
25.99 |
| 03 Chemical Sciences |
74.67 |
25.33 |
| 04 Earth Sciences |
74.84 |
25.16 |
| 11 Medical and Health Sciences |
74.27 |
25.73 |
| 08 Information and Computing Sciences |
74.28 |
25.72 |
| 09 Engineering |
74.55 |
25.45 |
| 12 Built Environment and Design |
72.14 |
27.86 |
| 07 Agricultural and Veterinary Sciences |
74.75 |
25.25 |
| 10 Technology |
74.67 |
25.33 |
| 05 Environmental Sciences |
73.84 |
26.16 |
| 15 Commerce, Management, Tourism and Services |
74.64 |
25.36 |
| 01 Mathematical Sciences |
74.63 |
25.37 |
| 02 Physical Sciences |
75.20 |
24.80 |
| 16 Studies In Human Society |
74.84 |
25.16 |
| 21 History and Archaeology |
71.88 |
28.12 |
| 14 Economics |
74.51 |
25.49 |
| 17 Psychology and Cognitive Sciences |
74.98 |
25.02 |
| 20 Language, Communication and Culture |
74.17 |
25.83 |
| 22 Philosophy and Religious Studies |
73.28 |
26.72 |
| 13 Education |
73.66 |
26.34 |
| 18 Law and Legal Studies |
72.13 |
27.87 |
| 19 Studies In Creative Arts and Writing |
74.07 |
25.93 |
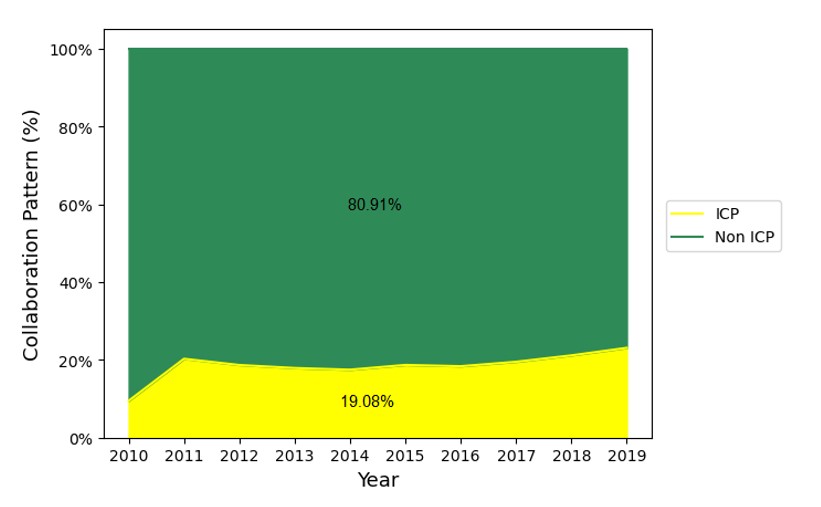
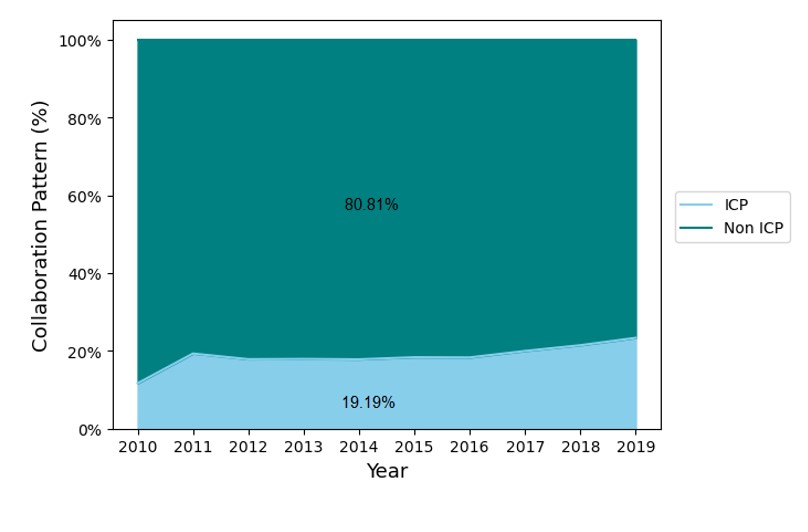
International Collaboration patterns in Female and Male 1st authored papers
It was analysed whether there exist differences in the propensity for International Collaboration in Female and Male
1st authored papers. For this purpose, the proportion of papers that involve international collaboration in both the sets
(Female 1st authored and Male 1st authored papers) were identified through the 'Country' information
in the Author-affiliation field. It is observed that both Female and Male 1st authored papers have almost similar
proportion of papers involving International Collaboration, with the International Collaboration Proportion in Female 1st
authored publications increasing from 9.47% in 2010
to 23.08% in 2019 and International Collaboration Proportion in Male 1st authored publications increasing
from 11.67% in 2010 to 23.34% in 2019. The figures
below show the international collaboration patterns in Female and Male 1st authored papers.
Citation Impact of Female and Male 1st authored papers
The citation impact of Female and male 1st authored papers are analysed by computing the cited percentage (proportion of papers that
attracted at least one citation) and Average Citations Per Paper for both the sets. It is observed that, in general, Female and Male 1st authored papers
have similar cited percentage values during 2010 to 2019 period. Further, the Average Citations per Paper values of Female and Male 1st authored papers
are also similar, with very minor variations. The table below shows the year-wise values of cited percentage and citations per paper for both
Female and Male 1st authored papers.
| Year |
Cited Percentage |
Citations per Paper |
| Female 1st per Paper |
Male 1st per Paper |
Female 1st per Paper |
Male 1st per Paper |
|
2010
|
12.88 %
|
16.34 %
|
18.79
|
18.90
|
|
2011
|
15.25 %
|
16.12 %
|
17.48
|
17.31
|
|
2012
|
17.76 %
|
16.66 %
|
15.04
|
15.20
|
|
2013
|
18.22 %
|
17.20 %
|
13.94
|
14.23
|
|
2014
|
19.01 %
|
18.09 %
|
12.47
|
13.11
|
|
2015
|
19.90 %
|
19.02 %
|
11.16
|
11.53
|
|
2016
|
19.14 %
|
19.11 %
|
9.82
|
10.02
|
|
2017
|
20.09 %
|
20.52 %
|
8.49
|
8.65
|
|
2018
|
23.66 %
|
24.04 %
|
6.81
|
6.93
|
|
2019
|
30.63 %
|
30.73 %
|
4.60
|
4.71
|
|
Overall
|
79.25 %
|
79.28 %
|
10.66
|
10.90
|