Comparison with other major countries
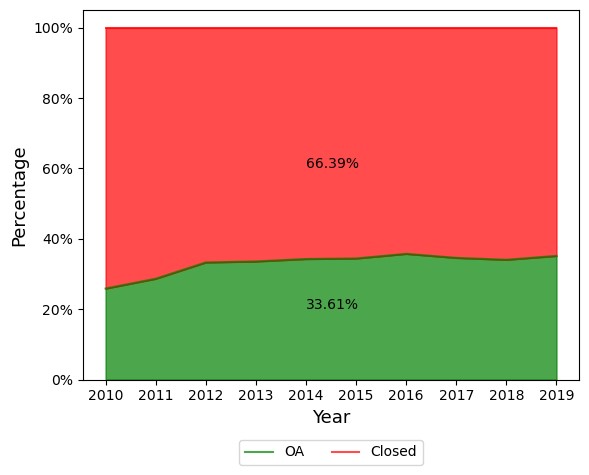
The Open Access levels of India are compared with 20 other major countries. It is observed that India is on the
Lower side of Open Access availability level, with only 33.61% papers available in Open Access. In comparison, Brazil has 62.91%
of the research papers in Open Access, Switzerland has 55.79% papers in Open Access, United Kingdom 55.59% papers in Open Access,
Netherlands (54.08%), Sweden (53.32%), Poland (51.68&). Only China (26.44%), Iran (28.3%) and Taiwan (31.03%) have OA
proportion lesser than India. The table below shows OA percentage for 20 major countries.
| Country | 2010 | 2011 | 2012 | 2013 | 2014 | 2015 | 2016 | 2017 | 2018 | 2019 |
|---|---|---|---|---|---|---|---|---|---|---|
| Australia | 30.11 | 33.79 | 37.54 | 39.94 | 41.55 | 44.03 | 46.99 | 48.56 | 48.92 | 48.97 |
| Brazil | 60.55 | 61.01 | 62.43 | 61.46 | 60.08 | 61.44 | 64.54 | 64.88 | 65.22 | 63.93 |
| Canada | 31.66 | 33.84 | 36.22 | 38.32 | 39.64 | 42.15 | 44.06 | 46.07 | 47.67 | 47.77 |
| China | 12.23 | 14.41 | 19.07 | 19.79 | 22.26 | 27.64 | 30.28 | 32.5 | 32.9 | 34.45 |
| France | 31.16 | 36.84 | 38.12 | 39.09 | 40.83 | 44.15 | 46.96 | 49.96 | 53.27 | 58.69 |
| Germany | 28.52 | 34.54 | 37.03 | 37.59 | 40.13 | 42.62 | 45.29 | 46.27 | 48.71 | 50.79 |
| India | 25.86 | 28.63 | 33.27 | 33.55 | 34.25 | 34.4 | 35.71 | 34.56 | 34.03 | 35.13 |
| Iran | 17.37 | 21.52 | 25.67 | 25.02 | 27.61 | 28.93 | 30.69 | 30.47 | 31.2 | 32.49 |
| Italy | 29.06 | 33.16 | 35.89 | 37.95 | 40.48 | 43.28 | 45.72 | 49.06 | 50.78 | 52.9 |
| Japan | 23.1 | 27.1 | 29.25 | 31.57 | 34.38 | 38.79 | 40.83 | 36.56 | 39.12 | 40.85 |
| Netherlands | 40.69 | 43.56 | 44.52 | 43.65 | 45.31 | 51.99 | 57.96 | 63.96 | 68.22 | 69.36 |
| Poland | 29.24 | 37.63 | 42.49 | 43.78 | 51.16 | 52.34 | 54.39 | 57.45 | 59.99 | 62.97 |
| Russia | 13.27 | 18.18 | 22.09 | 24.21 | 25.67 | 30.86 | 34.36 | 37.17 | 42.16 | 50.57 |
| South Korea | 23.78 | 26.5 | 29.97 | 31.65 | 34.13 | 36.91 | 39.34 | 42.14 | 44.5 | 46.83 |
| Spain | 32.48 | 36.27 | 39.92 | 40.8 | 45.07 | 48.27 | 51.15 | 54.52 | 57.06 | 58.98 |
| Sweden | 36.81 | 41.92 | 45.04 | 47.19 | 50.32 | 52.64 | 55.41 | 59.51 | 64.71 | 66.33 |
| Switzerland | 42.61 | 46.99 | 50.46 | 51.87 | 53.74 | 55.85 | 59.44 | 60.11 | 62.96 | 64.32 |
| Taiwan | 18.14 | 20.33 | 25.85 | 26.91 | 29.78 | 34.13 | 35.32 | 38.45 | 40.18 | 41.95 |
| UK | 33.76 | 37.58 | 41.24 | 45.57 | 51.34 | 57.2 | 65.79 | 69.11 | 71.06 | 69.15 |
| USA | 35.57 | 38.75 | 41.05 | 42.26 | 43.81 | 47.25 | 49.62 | 49.84 | 51.66 | 51.64 |
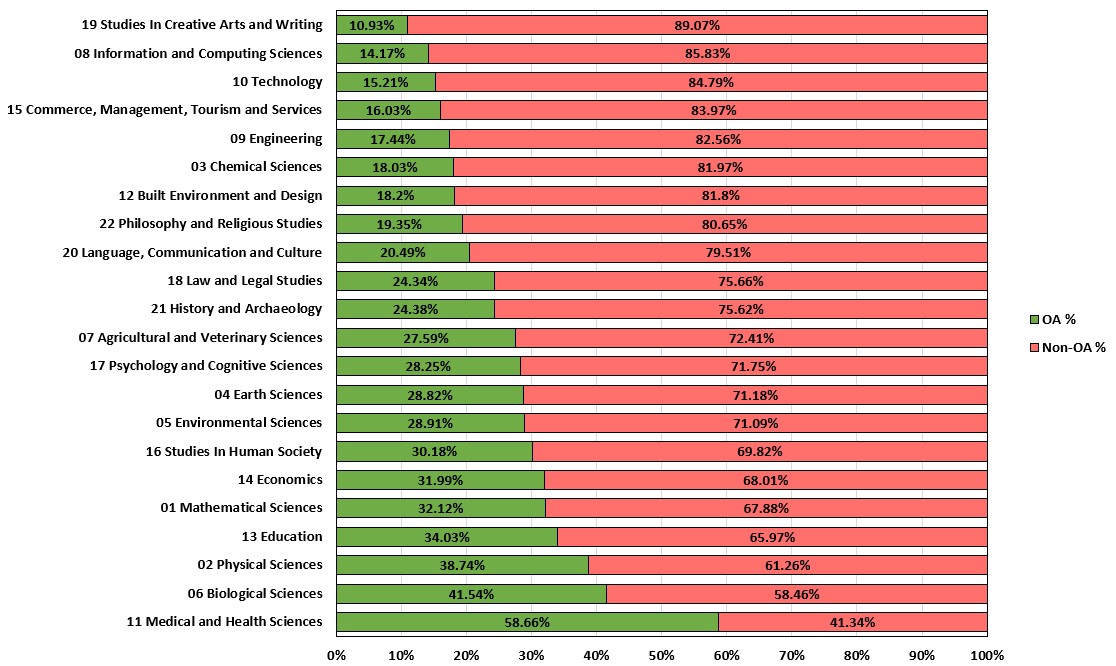
Subject area-wise Open Access availability of Indian Research Output
While India has overall 33.61% papers available in Open Access for the 2010- 2019 period, Open Access availability varies across
different subject areas. These variations are as large as 48%. Subjects like Studies in Creative Arts and Writing (10.93%),
Information and Computing Science (14.17%) and Technology (15.21%) have a very low proportion of papers available in OA;
subjects like Medical & Health Sciences (58.66%), Biological Sciences (41.54%) and Physical Sciences (38.74%) have
relatively higher proportion of papers available in Open Access.
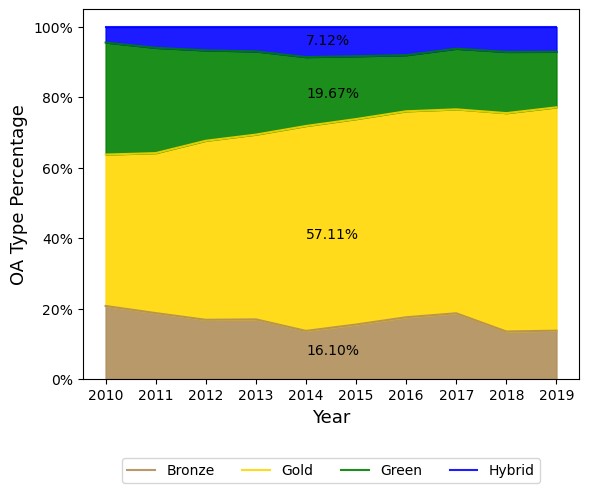
Open Access availability of Funded Research Output
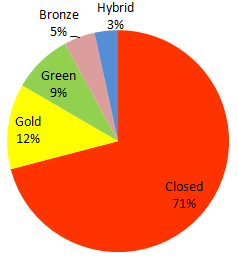
As it is often a condition and/or expectation of the funding agencies that research outputs out of publicly funded research projects should be openly accessible, therefore the research outputs out of the funded projects is analysed to find out what proportion of the research output is available in Open Access. it is observed that only about 29.06% of the funded research output in India is available in OA, though the availability has increased slightly from 25.22% in 2010 in 30.04% in 2019. The figure below (on the left) shows the year-wise Open Access availability of the funded research output. Out of the total funded research output during 2010-2019, 71% is Closed Access, 12% Gold Open Access, 9% Green Open Access, 5% Bronze Open Access and 3% Hybrid Open Access. The pie-chart below (on the right) shows the distribution.

Note: The above analysis/outputs are generated by the use of data obtained from Dimensions and Altmetric (a part of Digital Science).