Comparison with other major countries
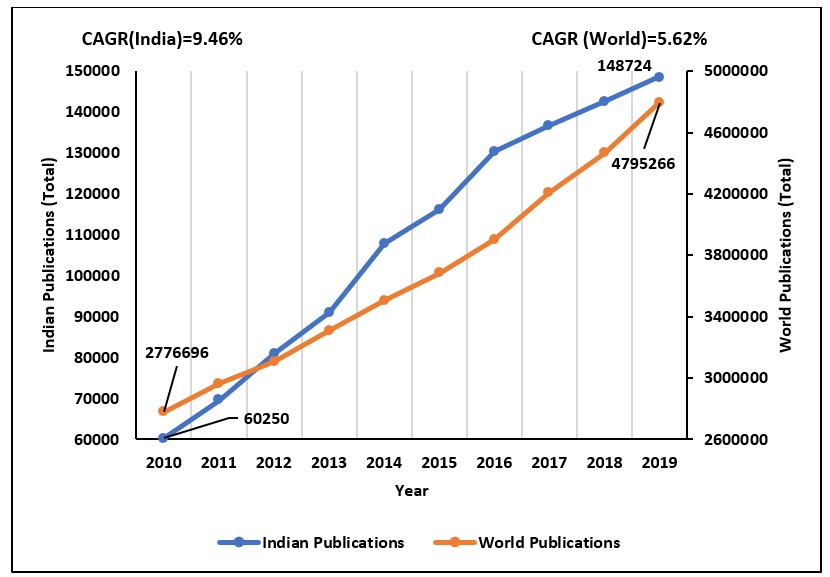
For a better understanding of India's research performance, the values of research output volume, CAGR, and global share
of 20 major countries are compared, as shown in the Table below. It can be seen that India has a high CAGR value of 9.46%,
which is lesser than only three countries - Russia (11.43%), Iran (10.56%) and China (9.50%). In terms of global share,
India accounts for
2.95% of the total research output of the world during 2010-2019 period.
| Rank |
Country |
No. of Research Publications |
CAGR % |
Global Share % |
| 1 |
United States |
6,181,247 |
3.09 |
16.83 |
| 2 |
China |
3,828,795 |
9.50 |
10.42 |
| 3 |
United Kingdom |
1,824,427 |
3.80 |
4.97 |
| 4 |
Japan |
1,694,585 |
1.09 |
4.61 |
| 5 |
Germany |
1,551,543 |
3.59 |
4.22 |
| 6 |
France |
1,103,707 |
2.40 |
3 |
| 7 |
India |
1,084,422 |
9.46 |
2.95 |
| 8 |
Canada |
970,336 |
3.84 |
2.64 |
| 9 |
Italy |
936,918 |
4.59 |
2.55 |
| 10 |
Australia |
840,791 |
6.66 |
2.29 |
| 11 |
Spain |
825,399 |
4.71 |
2.25 |
| 12 |
Brazil |
791,088 |
7.59 |
2.15 |
| 13 |
South Korea |
714,331 |
4.93 |
1.94 |
| 14 |
Russia |
616,395 |
11.43 |
1.68 |
| 15 |
Netherlands |
548,489 |
4.33 |
1.49 |
| 16 |
Switzerland |
417,766 |
5.11 |
1.14 |
| 17 |
Iran |
401,528 |
10.56 |
1.09 |
| 18 |
Poland |
364,627 |
8.63 |
0.99 |
| 19 |
Sweden |
354,801 |
5.05 |
0.97 |
| 20 |
Taiwan |
351,371 |
1.03 |
0.96 |
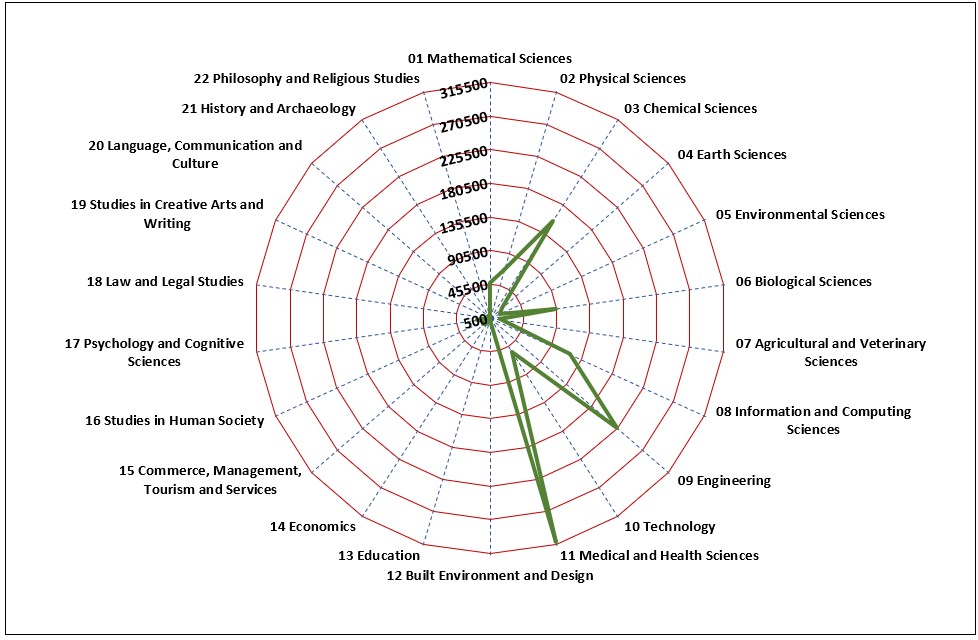
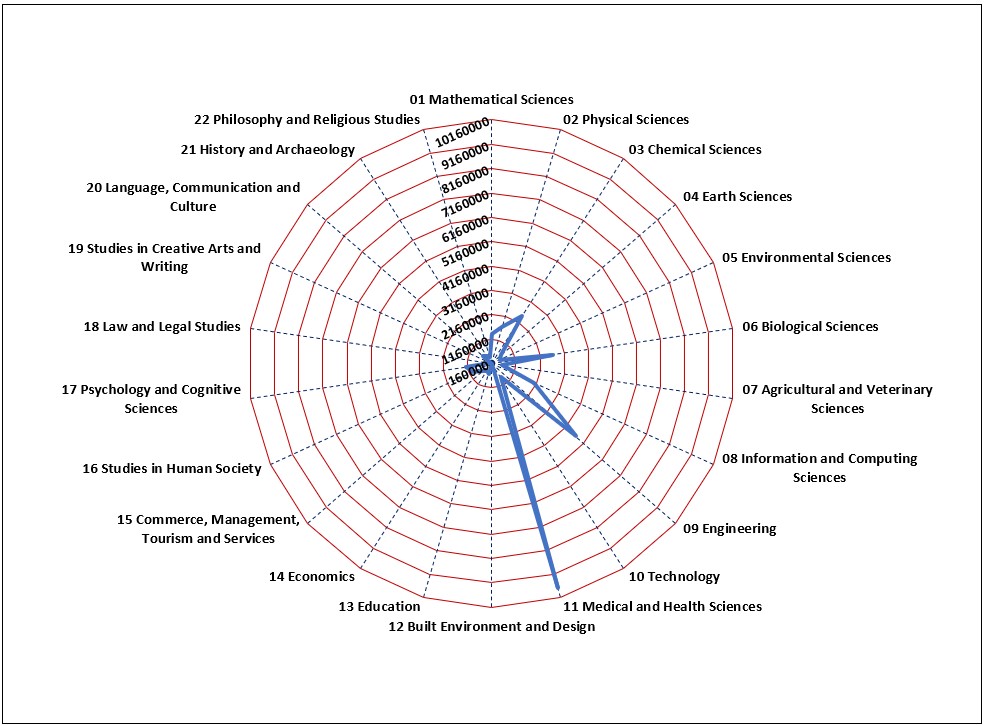
Subject area distribution of Indian Research Output
Indian research output is visualized in 22 major fields of research, as provided by the Dimensions database. India's research output is
dominated by subjects like Medical & Health Sciences, Engineering, Chemical Sciences and Information & Computing Sciences. The subject-area
distribution of Indian research output as well as the world-wide research output is shown in the figures below -
Subject Area-wise CAGR, Global Share and Rank
As seen in the subject area distribution above, India's research performance varies across different subject areas. For the 2010 to 2019 period,
India's global rank varies from 3rd in Chemical Sciences (and also Information & Computing Sciences, Technology) to 10th in Medical & Health Sciences,
15th in Studies in Human Society, 20th in History & Archaeology and 28th in Philosophy and Religious studies. These variations are observed
in subject-area wise global shares as well. While, Indian Research Output in Technology constitutes 6.63% of global share, it is just 0.34%
in Philosophy & Religious studies. The CAGR values in different subject areas also vary with Information and Computing Sciences (13.91%), Environmental Sciences
(13.43%) and Engineering (12.83%) being the three fastest growing subject areas. The CAGR values for India in all the subject areas are found to be
higher than the world average.
| Subject Area |
Indian Research Publications |
World Research Publications |
India's Global Share (%) |
India's Rank |
India's CAGR (%) |
World's CAGR (%) |
| 01 Mathematical Sciences |
47,936 |
1,371,625 |
3.49 |
7 |
10.78 |
3.22 |
| 02 Physical Sciences |
67,270 |
1,716,510 |
3.92 |
9 |
7.49 |
3.26 |
| 03 Chemical Sciences |
155,143 |
2,457,684 |
6.31 |
3 |
8.61 |
4.56 |
| 04 Earth Sciences |
20,959 |
668,745 |
3.13 |
12 |
8.79 |
4.97 |
| 05 Environmental Sciences |
14,591 |
508,979 |
2.87 |
11 |
13.43 |
8.09 |
| 06 Biological Sciences |
89,824 |
2,689,897 |
3.34 |
10 |
7.28 |
3.25 |
| 07 Agricultural and Veterinary Sciences |
13,518 |
574,047 |
2.35 |
12 |
6.59 |
3.44 |
| 08 Information and Computing Sciences |
117,753 |
2,067,798 |
5.69 |
3 |
13.91 |
5.19 |
| 09 Engineering |
224,630 |
4,726,435 |
4.75 |
4 |
12.83 |
5.98 |
| 10 Technology |
54,999 |
829,746 |
6.63 |
3 |
12.78 |
2.76 |
| 11 Medical and Health Sciences |
312,250 |
9,742,475 |
3.21 |
10 |
7.79 |
3.86 |
| 12 Built Environment and Design |
2,504 |
187,021 |
1.34 |
15 |
14.4 |
8.6 |
| 13 Education |
5,879 |
584,798 |
1.01 |
12 |
9.63 |
8.35 |
| 14 Economics |
10,666 |
527,544 |
2.02 |
12 |
13.68 |
5.62 |
| 15 Commerce, Management, Tourism and Services |
12,979 |
642,452 |
2.02 |
9 |
14.72 |
5.55 |
| 16 Studies in Human Society |
10,967 |
1,012,661 |
1.08 |
15 |
12.68 |
4.94 |
| 17 Psychology and Cognitive Sciences |
17,865 |
1,221,175 |
1.46 |
13 |
14.87 |
3.63 |
| 18 Law and Legal Studies |
1,631 |
232,805 |
0.70 |
18 |
13.65 |
6.13 |
| 19 Studies in Creative Arts and Writing |
621 |
162,723 |
0.38 |
21 |
13.55 |
2.36 |
| 20 Language, Communication and Culture |
4,623 |
627,089 |
0.74 |
16 |
9.96 |
5.07 |
| 21 History and Archaeology |
2,438 |
533,187 |
0.46 |
20 |
8.35 |
3.58 |
| 22 Philosophy and Religious Studies |
1,466 |
424,934 |
0.34 |
28 |
11.56 |
2.65 |